Importação e Exportação do Brasil
👇 Read the project documentation below the dashboard content.
▸ Objective
To analyze Brazil's imports and exports to identify trends, major trading partners, and sectors most affected over the years.
▸ Scope
The project covers data from 1997 to the present. The main data and variables analyzed include industries, countries, year/month of export/import, Brazilian states, etc. The visuals were created based on references from the Comex Stat website.
▸ Initial Challenges
I had to deal with large volumes of data, as the export and import tables contained millions of rows. Some spreadsheets came with insufficient columns/data.
▸ Insights
1. Increase in agribusiness exports 🌾
▸ Although over the years the FOB export value has increased, but in
2024 it dropped by 19.1% compared to 2023;
▸ Soybeans and corn remain the flagship products of Brazilian exports,
mainly to China.
2. Dependence on China 🏭
▸ China is by far Brazil's largest trading partner, purchasing large
volumes of commodities;
▸ Events such:
- Increase in domestic demand in China
- Trade and diplomatic agreements
- Increase in Brazilian agricultural production
- Crisis in the USA and other suppliers
- The impact of African swine fever
- Sanitary and food safety agreements
- The COVID-19 pandemic
3. Fluctuations in the mining sector ⛏️
▸ The collapse of the Brumadinho dam (2019) negatively impacted iron ore exports;
▸ The iron ore price in 2016 was attributed to the increase in excess supply;
▸ However, the recovery of iron ore prices boosted exports in the following years.
4. Impact of the pandemic (2020-2021) 😷
▸ There was a decrease in imports due to the slowdown in the economy and logistical difficulties;
▸ Agricultural exports remained strong, while sectors such as oil and manufactured goods experienced temporary declines.
5. Oil and fuel exports ⛽
▸ The pre-salt became a key player in Brazilian exports, with a focus on crude oil shipments to China and the USA.
6. Exchange rate fluctuations 💰
▸ The high dollar in recent years has made imports more expensive, reducing the influx of consumer goods.
7. Increase in the import of technology and industrial inputs 📦
▸ Brazil imported more semiconductors, medical equipment, and electronic components, mainly post-pandemic.
8. Trade agreements and tariff barriers 🌍
▸ Mercosul agreements facilitated trade with Argentina and other South American countries;
▸ Trade disputes, such as tariffs imposed by the US and Europe on certain sectors, affected imports/exports.
▸ Implemented Solution
To address the data volume issue, I retrieved the .csv files directly
from the government website without saving them locally, meaning that
as the website updates the file, my dataset is automatically updated.
On the other hand, to solve the problem of missing information in some
spreadsheets, I created an automation in Python to fetch the data
every Sunday, using Docker and my personal database.
To view the data extraction code, just click here:
![]() Explore the repository about this project on Github
Explore the repository about this project on Github
▸ Technologies used
Python, SQL, Docker, M, DAX, Figma, Power BI.
▸ Infrastructure
This was the infrastructure used, reducing data storage resources and being functional.
▸ Source Description
Public government databases are made available between the 5th and 10th of each month, containing data from the previous month. The website can be found here. Additionally, a data source was used to retrieve geographic data for the choropleth map.
▸ Data Quality
There were some missing values in the CGCE, ISIC, and ISIC_group tables. However, these were corrected using Python and a database.
▸ Transformations Performed
Not many transformations were needed as the data from the government website was already well-structured.
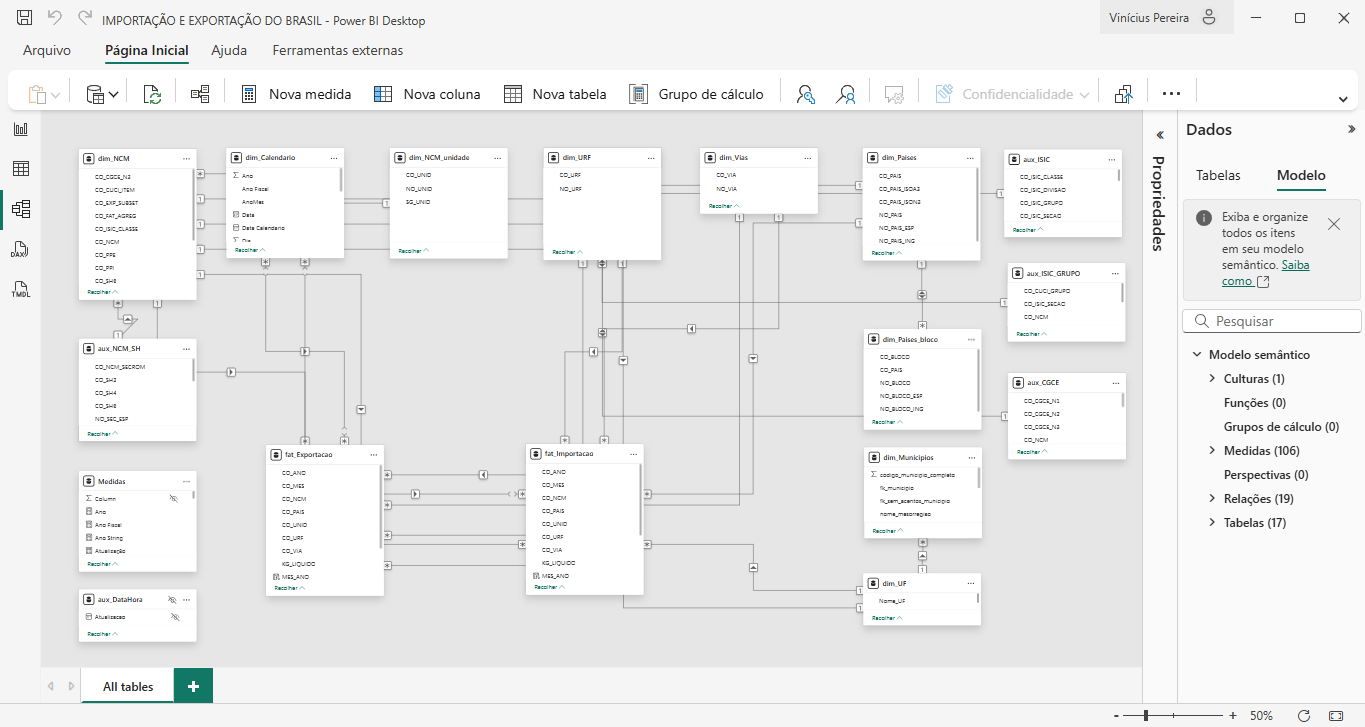
▸ Model
The model used was simple, but for some tables, a cross-filtering approach was necessary.